
Start here: The map pack is the group of local business results shown alongside a map in Google Search. Measure your position for a specific service across your real service area, then use local demand and your own sales data to decide where to focus.
Sources: keyword volumes from Semrush’s US database pulled October 22, 2026, a stored Local Howl map-pack grid from July 27, 2026, three dated client examples and Google’s public local-ranking guidance.
From local searches to potential customer value
Relevant monthly searches × click-through rate × inquiry rate × close rate
= estimated new customers per month
Estimated new customers × customer lifetime value
= potential lifetime revenue from those customers
Planning model: not a forecast, guaranteed ranking or monthly revenue figure. Use your own observed rates and account for service-area coverage, costs and margin.
Most Google Maps SEO services conversations start with ROI. That is fine, but it is not where an owner should start.
The first question is simpler: can people see you when they are ready to buy?
Service searches can indicate a current need, but a keyword does not establish whether someone is ready to book. Compare relevant demand with the inquiries and booked work in your own records.
When your business appears below the initial map results, customers may choose another company before opening your profile. Check where this happens for the services and neighborhoods that matter to you.
FROM OUR RESEARCH
Measure the same search again.
For Cool Breeze, Inc., “hvac mountain brook al” reached the top three at 25 more tested locations in the later scan. We compare the same query and the same points so you can see whether your reach is changing across the area.
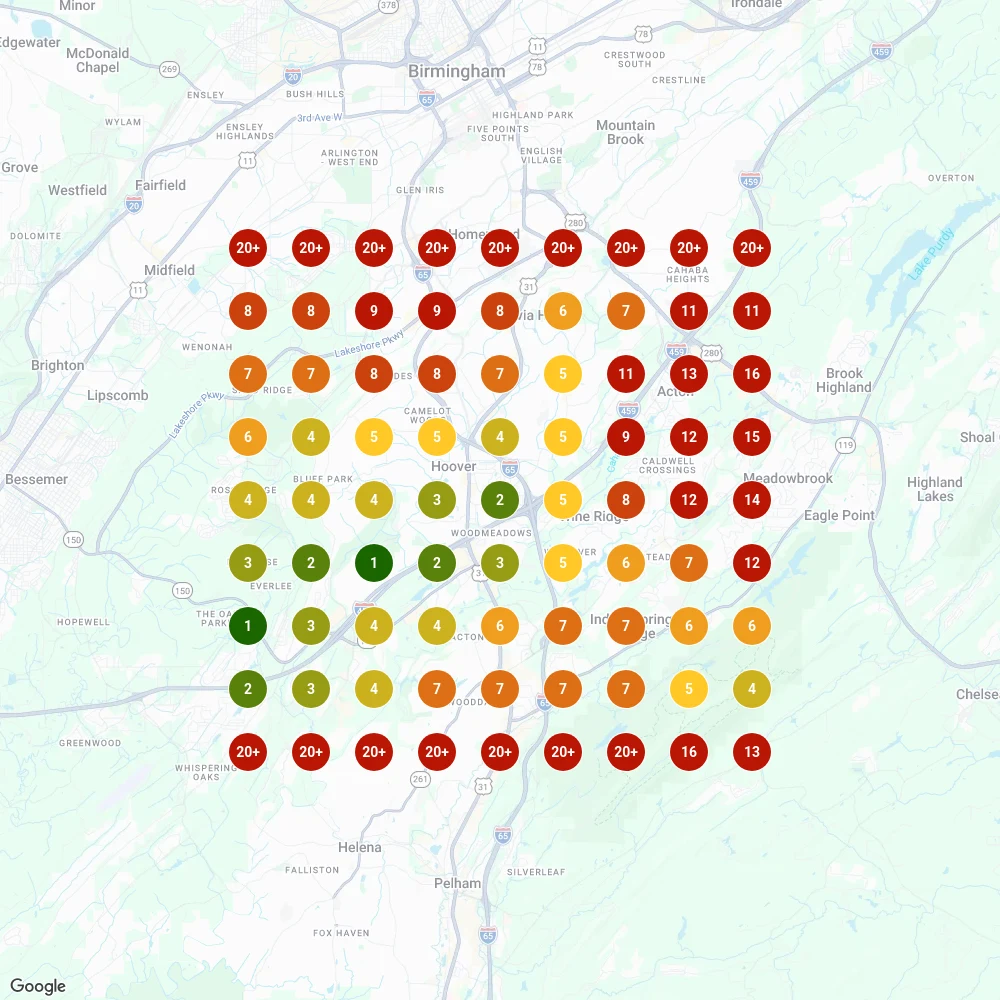
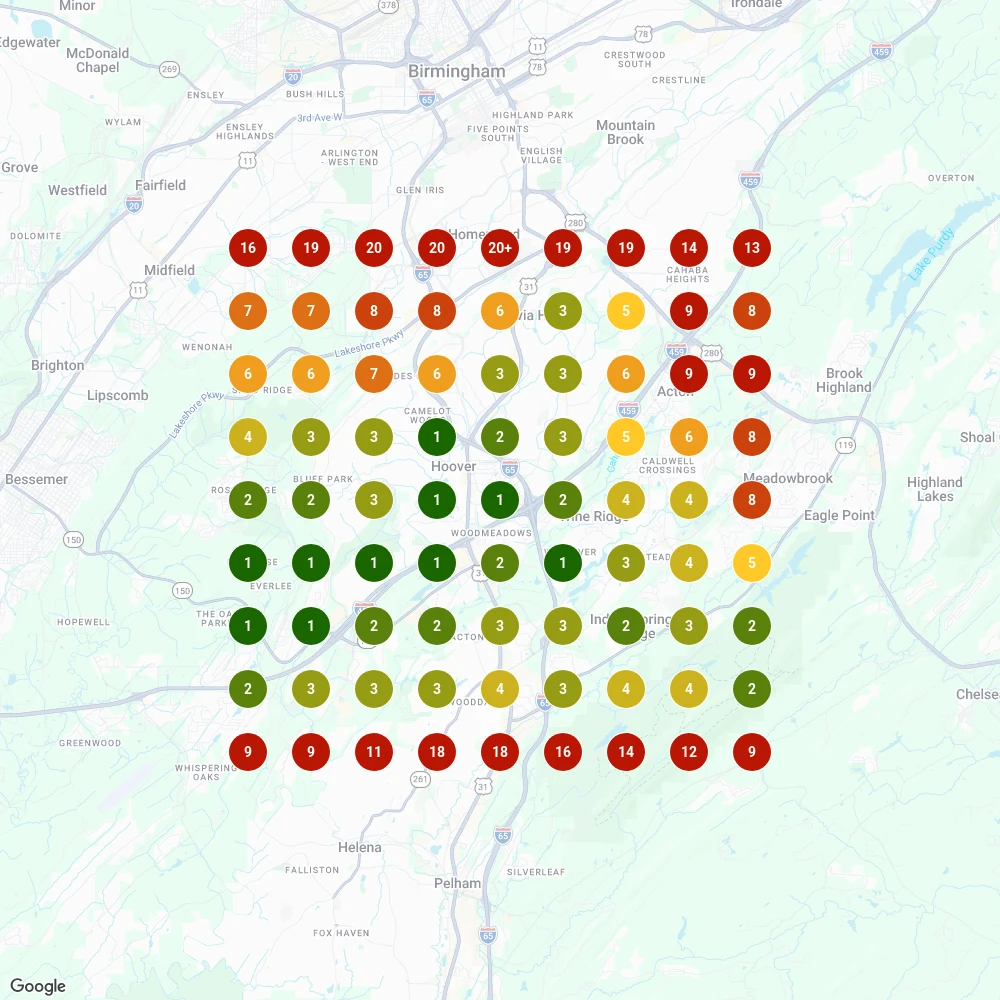
Real client comparison. Both scans use the same 9 × 9 grid and five-mile radius. June 2 scan · August 8 scan · Research method
How to read this example

Turn the opportunity estimate into a scoped plan
An opportunity estimate helps you evaluate potential demand; it does not show why a business ranks or replace a service proposal. Once the assumptions are documented, compare the actual profile, website, listings and competitor evidence before choosing work.
See our Google Maps SEO services for home-service businesses for what’s included and the questions to ask before hiring. Start with the automated website audit, then request a human review of your service-area visibility if needed.
What the demand looks like: dated Semrush data
Keyword-tool volumes estimate monthly searches for one phrase. They are not visits, unique people or customers, and related phrases overlap, so don’t add them together.
Semrush US database, national monthly search volume, pulled October 22, 2026.
| Keyword | US monthly searches |
|---|---|
| plumber near me | 550,000 |
| ac repair near me | 201,000 |
| emergency plumber near me | 135,000 |
| roof repair near me | 90,500 |
| foundation repair near me | 60,500 |
| gutter installation near me | 33,100 |
National “near me” totals are a ceiling, not your market. A contractor only competes for the searches made inside its service area, and a national total does not tell you how many of those happen near you. For a planning view of one market, look at phrases that include the city.
Example market: Los Angeles. Semrush US database, monthly search volume for city-modified phrases, pulled October 22, 2026. Related phrases may overlap.
| City-modified keyword | Monthly searches |
|---|---|
| plumber los angeles | 2,900 |
| ac repair los angeles | 2,400 |
| hvac repair los angeles | 1,900 |
| garage door repair los angeles | 1,900 |
| roof repair los angeles | 1,000 |
| electrician los angeles | 1,000 |
| foundation repair los angeles | 1,000 |
| emergency plumber los angeles | 720 |
Keep national “near me” estimates, city-modified phrases and suburb phrases in separate planning views. Do not add them together as unique demand: broad and emergency-service phrases can overlap, and keyword tools may group related searches. Select a relevant non-overlapping query group for each scenario and record what was excluded before estimating clicks or customers.
Use the math as a planning tool, not a promise. Keyword volumes are estimates, not measured traffic, unique customers or guaranteed requests. Document assumptions and possible overlap before estimating clicks, inquiries and customers, then applying customer lifetime value.
That is how the scope should be built: relevant local demand, measured conversion rates, and customer value, with map-pack gaps prioritized by realistic potential. The right plan is not “do SEO everywhere.” It is “push these services, in these neighborhoods, because this is where visibility can turn into booked jobs.” Use the free website audit as a starting point, then confirm the scope of a human-reviewed local visibility assessment before deciding on implementation.
What customers can see in the map results
Map pack SEO is the work of improving the business signals that help a local company show up in the Google Maps results and the local three-pack. For home-service searches, that small map box is often the first serious decision point. The customer sees distance, reviews, business names, categories, photos, hours, and call buttons before they ever read a full website.
That is why the opportunity is not only organic traffic. It is being present when a homeowner has an urgent, expensive problem and is choosing who to call. A business can have a decent website and still lose demand if the map gives the first call to another company.
For the owner, the question is simple: how much search demand exists, what is a customer worth, and how many neighborhoods are currently sending that demand to someone else?
Estimate potential customers with your own rates
Search volume is not a customer count. Estimate potential customers first, using your own measured conversion rates.
- Demand: relevant local searches
- Conversion: clicks → inquiries → customers
- Value: customers × lifetime value
Example query grouping (not measured demand).
| Service scenario | Candidate query group | Excluded from this scenario |
|---|---|---|
| General plumbing | General plumbing phrases for one selected geography | Emergency-only phrases and national population-prorated estimates |
| Emergency plumbing | Emergency-intent plumbing phrases for the same selected geography | General plumbing totals already considered in another view |
| Cooling-system repair | AC/HVAC repair phrases reviewed together for overlap | Treating similar AC and HVAC volumes as automatically additive |
These groups illustrate a deduplication decision, not proof that tool estimates are independent. When overlap cannot be resolved, report separate scenarios rather than a combined total.
Planning formula: monthly relevant searches × click-through rate × inquiry rate × customer close rate = estimated new customers per month. Multiply that estimate by your customer lifetime value to estimate their potential lifetime revenue, not revenue earned in that month.
Use non-overlapping keyword estimates, realistic service-area coverage, and rates from your own tracking. Treat the result as a scenario, not a forecast or a ranking guarantee. Account for costs and margin before evaluating return on investment. To run the cost side with your own numbers, use our local SEO ROI calculator.
The top 10 is more crowded than it looks
In one stored Local Howl map-pack grid report from July 27, 2026, we reviewed an anonymized gutter-installation market across a 9x9 grid and a 10-mile radius. The business appeared in almost every search point, but visibility still did not mean ownership of the top three.
Stored Local Howl map-pack grid report, July 27, 2026. One anonymized gutter-installation market; a historical example, not a forecast for your market.
| Count | What it measured |
|---|---|
| 81 | search points checked in the map-pack grid |
| 162 | different businesses found across the report |
| 77 | businesses that appeared somewhere in the top 10 |
| 11 | businesses that owned at least one top-three spot |
That is the whole fight. This was not one company trying to move from #7 to #3 in a vacuum. The report found 162 different businesses somewhere in the local results, 77 different businesses appearing in the top 10, and only 11 businesses winning at least one top-three spot across the grid.
Compare top-three coverage with overall visibility. A business appearing lower in results can still receive inquiries. Use its own records to assess the business effect.
This is why “we rank on Google” is too vague. Rank where? For which service? From which neighborhood? Against which competitors? In the map pack, visibility is geography.
Visible is not the top three: two real examples
Two of our own clients show the gap on matched Local Falcon grids (9x9, 10-mile radius).
- Amprite Electric Company, Nashville: on October 5, 2026 it appeared in the top 20 at 80 of 81 grid points for “industrial electrician nashville”, and in the top three at just one.
- Coastal Roofworks, Savannah: for “roof repair Savannah GA”, its average rank where found improved from 10.2 to 8.6 between May 21 and October 5, 2026, while its top-three share only moved from 0% to 2.5%.
Both businesses are close enough to be seen and still sit below the top three at most points. That band, positions 4 to 10 across the map, is where the opportunity math starts.
How to find the opportunity
Start with one service and a defined area so you can check the demand, competitors and business value before expanding the plan.
- Pick one high-value service. AC repair, roof repair, drain cleaning, foundation repair, gutter installation, garage door repair.
- Pull Semrush volume. Use the service plus “near me,” city, or emergency modifier. For bigger planning, use local keyword research for small business so you do not chase vanity searches.
- Add customer lifetime value. Do not use wishful thinking. Use what one real customer is worth over time.
- Check the map grid. See where you rank across the market, not just from your office, then track local rankings on Google Maps over time.
- Count near-wins. Positions 4-10 can identify useful candidates for investigation. Check relevance, competition and real service-area coverage before treating them as achievable gains.
What Google says still matters: local rankings are mainly driven by relevance, distance, and prominence. You cannot buy a better local ranking from Google, but you can improve the signals around your Google Business Profile, review management, citation audit, service pages, and authority.
Decide which work is worth funding
ROI matters after the work starts. But before that, the decision is more basic.
Are you visible when people search for the work you want?
Compare the profiles and websites of the businesses appearing for those searches. Use confirmed gaps to decide which profile updates, service pages or listing corrections deserve attention.
A useful report should show the starting point, recommended work and how progress will be checked. Use that information to decide whether the proposed investment fits your business.
Work through one service and one area
Choose a service you can profitably deliver.
Write down the service, the towns or neighborhoods you serve, and any limits on travel or capacity. Start with a phrase customers would use for that job. Keep broad service searches and emergency-only searches in separate planning views when their demand may overlap. Record the keyword tool, geography and date beside every volume estimate. A national “near me” total does not tell you how many searches happen in your market.
Read the map at individual search locations.
Open the Cool Breeze scans above and compare the same query, “hvac mountain brook al,” at the same points. The June 2 scan shows 11 of 81 locations in the top three; August 8 shows 36. That is 25 additional tested locations, not 25 customers. On your own grid, note which weak points are inside areas you actually serve. Check the nearby businesses appearing there before deciding what those gaps may be worth.
Build a scenario using your own business numbers.
Keep the stages separate: relevant searches, clicks, inquiries, customers and customer value. Use your measured rates where you have them. If you cannot connect profile activity to inquiries and booked work, leave the missing rate visible and improve tracking before presenting a revenue estimate. Applying customer lifetime value gives potential revenue over the customer relationship; it does not make that revenue arrive in one month.
Choose work you can check again.
Investigate the profile, service pages and relevant competitors for the selected search. Agree on specific changes and save the starting grid. Repeat the query with the same coordinates and settings so the comparison is useful. The Cool Breeze example shows how coverage changed over 67 days; it does not identify which change caused it. Compare inquiries and booked work separately before judging the business return.
What it actually takes to do this yourself
You’ll need reliable inputs before an estimate is useful enough to guide a spending decision.
- Tools
- Search-volume estimates, a grid rank tracker and your own business data.
- Access
- Your profile data and your own sales numbers.
- Know-how
- Checking evidence of demand, reading competitor coverage and keeping estimates separate from expected sales.
- Upkeep
- Volume and competitors change. Re-check before you spend on the plan.
Where owners get stuck
- Using national estimates for a local market.
- Assuming a service-and-city phrase has demand without checking it.
- Treating every search as a future click or customer.
- Estimating the opportunity without deciding what work is needed.
How Local Howl can help
Your program sets the scope. We’ll agree on who handles each task and how we’ll report it.
DO IT YOURSELF
You can choose the services and neighborhoods that matter, supply real job values and close rates, and review who appears in local results. A grid tracker and keyword tool add detail. Keep the settings and assumptions with your notes so you can repeat the check and understand what changed.
- Pull local search volume
- Scan your current positions
- Study the top three
- Run the math on your own numbers
- Turn it into a plan
- Do the plan
We can check the inputs and show you the gap before you decide what to invest in.
WITH LOCAL HOWL
You need to know whether the services you want to grow have demand, how visible you are and what your business can earn from suitable inquiries. We bring those pieces together before recommending the work. Your plan sets out what we will handle and how we will review progress with you.
- We check estimated demand for services you actually offer
- We measure your current map coverage
- We compare the businesses appearing for those searches
- We explain the opportunity and agree on a practical scope of work
Guidance checked November 18, 2026. Read the source: